
The normalize function in Scikit-Learn’s preprocessing module is a versatile tool that allows you to normalize data along specified axes or by using different normalization techniques. Normalization is a crucial step in preparing data for machine learning models, as it helps to scale features and improve the performance of algorithms.
Why Normalize Data?
Normalization transforms the features of your dataset to have a common scale, preventing certain features from dominating the learning process due to their larger values. This is especially important when working with algorithms that are sensitive to the scale of input features, such as distance-based algorithms.
Normalization Techniques
- L1 Normalization: Also known as Least Absolute Deviations, it scales the data so that the sum of absolute values of each row is 1.
- L2 Normalization: Also known as Least Squares, it scales the data so that the sum of squares of each row is 1.
- Max Normalization: Scales the data based on the maximum value of each row.
- MinMax Normalization: Scales the data based on the minimum and maximum values of each row.
Use Cases
L1 Normalization
Useful when you want to ensure that the sum of the absolute values of each data point is consistent across samples.
L2 Normalization
Suitable when you want to ensure that the sum of squares of each data point is consistent across samples.
Max Normalization
Appropriate when you want to ensure that all features are scaled within the same maximum range.
MinMax Normalization
Ideal when you want to scale features between a specific range (e.g., 0 and 1).
Benefits of Using normalize
- Enhances the performance of machine learning algorithms that are sensitive to feature scaling.
- Prevents certain features from dominating the learning process due to their larger magnitudes.
- Ensures consistent scaling across different samples, leading to improved generalization.
Python Code Examples
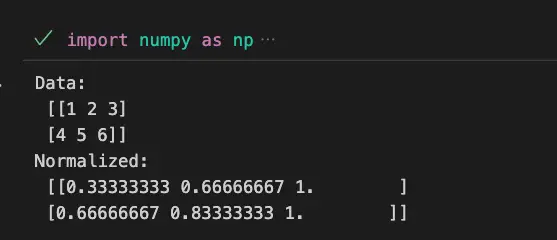
Example 1: Normalizing Data with L2 Norm
import numpy as np
from sklearn.preprocessing import normalize
data = np.array([[1, 2, 3],
[4, 5, 6]])

normalized_data = normalize(data, norm='l2')

print('Data:\n',data)
print('Normalized:\n',normalized_data)

Example 2: Normalizing Data with Max Norm
import numpy as np
from sklearn.preprocessing import normalize

data = np.array([[1, 2, 3],
[4, 5, 6]])

normalized_data = normalize(data, norm='max')
print('Data:\n',data)
print('Normalized:\n',normalized_data)
Visualize Scikit-Learn Preprocessing normalize with Python
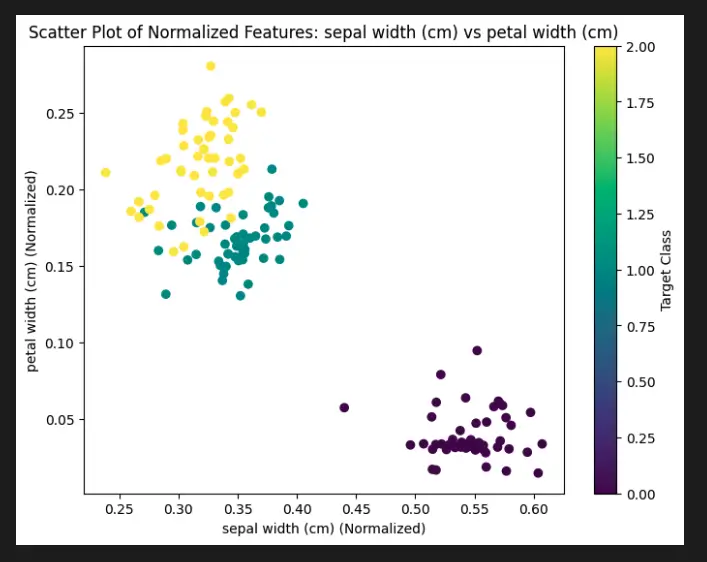
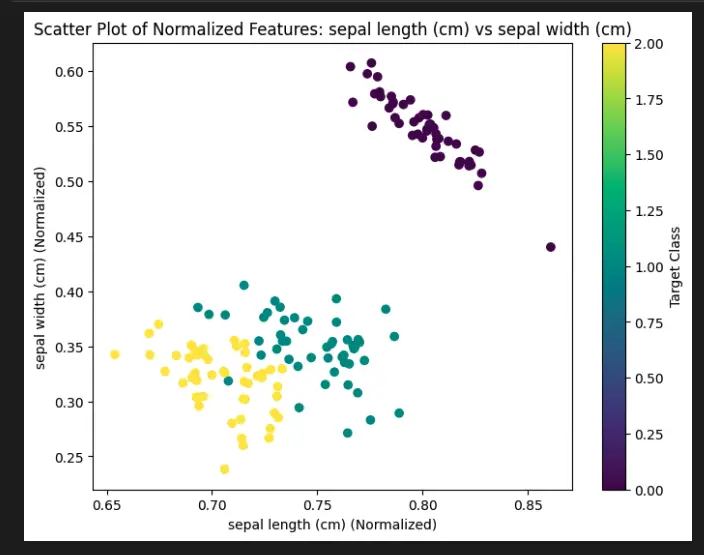
To demonstrate the visualization of the Scikit-Learn Preprocessing normalize function, we will use the built-in Iris dataset. We will normalize the features of the dataset and create scatter plots to visualize the effect of normalization.
import numpy as np
import matplotlib.pyplot as plt
from sklearn.datasets import load_iris
from sklearn.preprocessing import normalize

# Load the Iris dataset
iris = load_iris()
X = iris.data
feature_names = iris.feature_names

# Normalize the features using L2 normalization
normalized_X = normalize(X, norm='l2')

# Create scatter plots for each pair of normalized features
for i in range(normalized_X.shape[1]):
    for j in range(i + 1, normalized_X.shape[1]):
        plt.figure(figsize=(8, 6))
        plt.scatter(normalized_X[:, i], normalized_X[:, j], c=iris.target, cmap='viridis')
        plt.xlabel(feature_names[i] + ' (Normalized)')
        plt.ylabel(feature_names[j] + ' (Normalized)')
        plt.title(f'Scatter Plot of Normalized Features: {feature_names[i]} vs {feature_names[j]}')
        plt.colorbar(label='Target Class')
        plt.show()
You will end up with a bunch of plots showing each pair of normalized features (like the one below).
Important Concepts in Scikit-Learn Preprocessing normalize
- Data Scaling Techniques
- Feature Normalization
- L1 and L2 Norms
- Normalization Methods
- Effect on Distance Metrics
To Know Before You Learn Scikit-Learn Preprocessing normalize
- Basic understanding of data preprocessing in machine learning
- Familiarity with feature scaling and normalization concepts
- Understanding of data distributions and their effects on algorithms
- Knowledge of distance metrics and their role in machine learning
- Basic understanding of Scikit-Learn library and its preprocessing module
What’s Next?
- Feature selection techniques to enhance model performance
- Exploration of various data transformation methods
- Introduction to dimensionality reduction techniques like Principal Component Analysis (PCA)
- Advanced normalization techniques such as Z-score normalization
- Deeper exploration of Scikit-Learn’s preprocessing module
Relevant entities
| Entity | Properties |
|---|---|
| Scikit-Learn Preprocessing normalize | Function in Scikit-Learn’s preprocessing module for data normalization. |
| Normalization | Process of scaling data to have a common range, preventing features from dominating due to their magnitude. |
| L1 Normalization | Scaling data so that the sum of absolute values of each row is 1. |
| L2 Normalization | Scaling data so that the sum of squares of each row is 1. |
| Max Normalization | Scaling data based on the maximum value of each row. |
| MinMax Normalization | Scaling data based on the minimum and maximum values of each row. |
Considerations
Choose the appropriate normalization technique based on the characteristics of your dataset and the requirements of your machine learning algorithm.
Ensure that you understand the impact of normalization on your data and the algorithm’s behavior.
Keep in mind that normalization does not always guarantee better results; some algorithms might perform better with raw data.
Sources
- scikit-learn.org/stable/modules/generated/sklearn.preprocessing.normalize.html" target="_blank" rel="noreferrer noopener">Scikit-Learn Documentation – preprocessing.normalize
- Analytics Vidhya – A Comprehensive Guide to Feature Scaling
- DataCamp – Preprocessing in Data Science (Part 1)
Conclusion
Scikit-Learn’s normalize function is a valuable tool in the preprocessing toolbox, allowing you to easily scale and normalize data for machine learning tasks. By applying the right normalization technique, you can enhance the performance and accuracy of your models, leading to better predictions and insights from your data.
