
If you’re delving into the realm of machine learning, you might have encountered the term Scikit-Learn Preprocessing SplineTransformer.
In this article, we’ll explore what this topic entails and how it fits into the broader context of machine learning preprocessing techniques.
SplineTransformer() in PythonUnderstanding SplineTransformer
SplineTransformer is a preprocessing tool provided by the Scikit-Learn library that enables the transformation of features using splines. Splines are mathematical functions used to interpolate or approximate complex relationships within data.
Key Concepts
Before diving into the details of SplineTransformer, it’s important to be familiar with a few key concepts:
- Splines: Mathematical functions used for smooth approximation of data.
- Feature Engineering: Process of creating new features or modifying existing ones.
- Preprocessing: Techniques to prepare data for machine learning algorithms.
Benefits and Use Cases
The SplineTransformer can be valuable in scenarios where data relationships are nonlinear and simple transformations won’t suffice. It allows you to capture complex patterns without manually engineering new features.
Implementation and Application
To apply SplineTransformer, you’ll first need to import it from Scikit-Learn and initialize an instance. Then, you can fit and transform your data using splines. This can be particularly useful when dealing with features that exhibit nonlinear relationships.
Considerations and Limitations
While SplineTransformer offers flexibility in capturing intricate patterns, it’s important to note that splines can lead to overfitting if not used cautiously. As with any preprocessing technique, it’s advisable to validate the impact on model performance.
Python Code Example
from sklearn.preprocessing import SplineTransformer
import numpy as np
# Create some example data
data = np.array([[1.0, 2.0], [2.0, 3.0], [3.0, 4.0]])
# Initialize SplineTransformer
spline_transformer = SplineTransformer(
n_knots=3,
degree=2)
# Fit and transform data
transformed_data = spline_transformer.fit_transform(data)
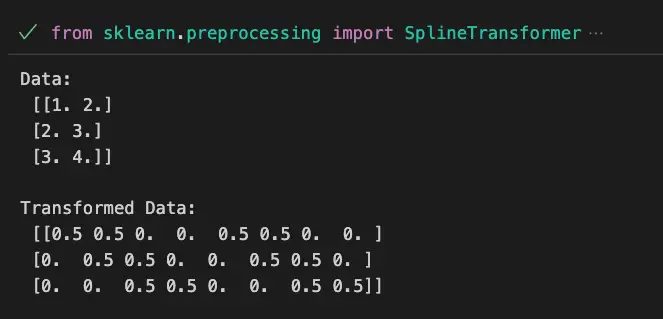
print(f'Data:\n {data}\n')
print(f'Transformed Data:\n {transformed_data}\n')In this example, we’re using the SplineTransformer from Scikit-Learn to transform the given dataset X using splines. The n_knots parameter specifies the number of knots (breakpoints) in the spline, and the degree parameter indicates the degree of the spline functions. The transformed data is printed for observation.
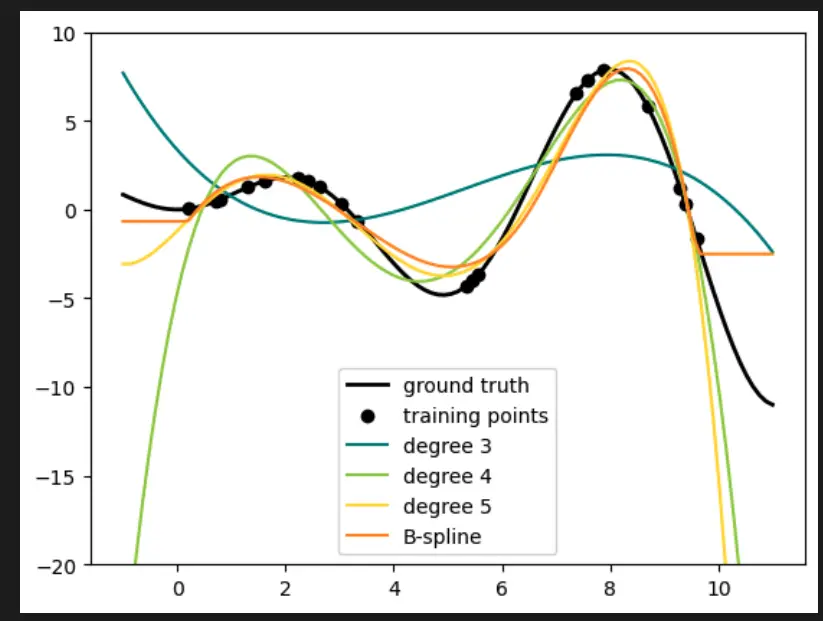
Visualize Scikit-Learn Preprocessing SplineTransformer with Python
The visualization below is credit to Mathie Blondel and al taken from the scikit-learn.org/stable/auto_examples/linear_model/plot_polynomial_interpolation.html#sphx-glr-auto-examples-linear-model-plot-polynomial-interpolation-py">official Scikit-learn documentation on SplineTransformer.
# Author: Mathieu Blondel
#         Jake Vanderplas
#         Christian Lorentzen
#         Malte Londschien
# License: BSD 3 clause

import matplotlib.pyplot as plt
import numpy as np

from sklearn.linear_model import Ridge
from sklearn.pipeline import make_pipeline
from sklearn.preprocessing import PolynomialFeatures, SplineTransformer

def f(x):
    """Function to be approximated by polynomial interpolation."""
    return x * np.sin(x)


# whole range we want to plot
x_plot = np.linspace(-1, 11, 100)

x_train = np.linspace(0, 10, 100)
rng = np.random.RandomState(0)
x_train = np.sort(rng.choice(x_train, size=20, replace=False))
y_train = f(x_train)

# create 2D-array versions of these arrays to feed to transformers
X_train = x_train[:, np.newaxis]
X_plot = x_plot[:, np.newaxis]

# plot function
lw = 2
fig, ax = plt.subplots()
ax.set_prop_cycle(
    color=["black", "teal", "yellowgreen", "gold", "darkorange", "tomato"]
)
ax.plot(x_plot, f(x_plot), linewidth=lw, label="ground truth")

# plot training points
ax.scatter(x_train, y_train, label="training points")

# polynomial features
for degree in [3, 4, 5]:
    model = make_pipeline(PolynomialFeatures(degree), Ridge(alpha=1e-3))
    model.fit(X_train, y_train)
    y_plot = model.predict(X_plot)
    ax.plot(x_plot, y_plot, label=f"degree {degree}")

# B-spline with 4 + 3 - 1 = 6 basis functions
model = make_pipeline(SplineTransformer(n_knots=4, degree=3), Ridge(alpha=1e-3))
model.fit(X_train, y_train)

y_plot = model.predict(X_plot)
ax.plot(x_plot, y_plot, label="B-spline")
ax.legend(loc="lower center")
ax.set_ylim(-20, 10)
plt.show()
This code is an example that demonstrates how to use polynomial interpolation and B-spline transformation to approximate a given function. Here’s a breakdown of what the code does:
- The code starts with importing necessary libraries:
matplotlib.pyplotfor plotting,numpyfor numerical computations, and specific modules from scikit-learn likeRidge,make_pipeline,PolynomialFeatures, andSplineTransformer. - The
f(x)function is defined. This is the function that we want to approximate using polynomial interpolation. - A range of values (
x_plot) is created to represent the x-axis of the plot, ranging from -1 to 11. - Training data is generated using
np.linspaceto create 100 equally spaced values between 0 and 10. Then, a random subset of 20 points is chosen from this range asx_train. - The corresponding
y_trainvalues are calculated by applying thef(x)function to each value inx_train. - The training data is structured into 2D arrays (
X_trainandX_plot) that are compatible with the transformers. - The code creates a plot using
plt.subplots()and sets a color cycle for the plots. - The ground truth function is plotted using the
f(x_plot)values. - The training points are scattered on the plot.
- For different degrees of polynomial features (3, 4, and 5), the code creates a pipeline with
PolynomialFeaturesandRidgeregression, fits the model to the training data, predicts the values forX_plot, and plots the predictions. - The B-spline transformation with 4 knots and degree 3 is applied using
SplineTransformer. The model is again fitted and predicted values are plotted. - Legends, labels, and plot adjustments are made for clarity.
- The final plot is displayed using
plt.show().
In summary, this code showcases how to use polynomial interpolation and B-spline transformation to approximate a given function and visualize the results using Matplotlib. Different degrees of polynomial features and B-spline transformations are demonstrated on the same plot to compare their effects on the approximation.
SplineTransformer() in PythonImportant Concepts in Scikit-Learn Preprocessing SplineTransformer
- Feature Transformation
- Splines and Knots
- Nonlinear Relationships
- Polynomial Degrees
- Overfitting Prevention
To Know Before You Learn Scikit-Learn Preprocessing SplineTransformer?
- Basic understanding of preprocessing techniques in machine learning.
- Familiarity with linear and nonlinear relationships in data.
- Knowledge of feature engineering and transformation methods.
- Understanding of polynomial degrees and their impact on modeling.
- Awareness of overfitting and strategies to prevent it.
Having these prerequisites will help you grasp the concepts of Scikit-Learn Preprocessing SplineTransformer more effectively.
Understanding these concepts is crucial for comprehending the functionality and utility of the Scikit-Learn Preprocessing SplineTransformer in machine learning.
What’s Next?
- Ensemble Methods in Machine Learning
- Advanced Feature Engineering Techniques
- Regularization Techniques
- Nonlinear Regression Models
After learning about Scikit-Learn Preprocessing SplineTransformer, diving into these topics will further enhance your machine learning knowledge and toolkit.
Relevant entities
| Entity | Properties |
|---|---|
| SplineTransformer | Preprocessing tool in Scikit-Learn for transforming features using splines. |
| Splines | Mathematical functions used to approximate complex data relationships. |
| Feature Engineering | Process of creating or modifying features to enhance model performance. |
| Preprocessing | Techniques to prepare data for machine learning algorithms. |
| Nonlinear Relationships | Data patterns that cannot be captured by linear transformations. |
| Overfitting | When a model captures noise rather than true patterns in data. |
Sources
- scikit-learn.org/stable/modules/generated/sklearn.preprocessing.SplineTransformer.html" target="_blank" rel="noreferrer noopener">Scikit-Learn Documentation – SplineTransformer
Conclusion
Scikit-Learn Preprocessing SplineTransformer provides a powerful tool for capturing complex relationships within data, making it an important addition to your machine learning preprocessing toolkit. By understanding its concepts and applications, you can effectively leverage splines to enhance your models.
