
Machine learning often involves transforming data to enhance its quality and improve model performance. Scikit-Learn’s preprocessing module offers a powerful tool called power_transform that aids in transforming skewed or non-Gaussian distributed data into a more Gaussian-like distribution.
 power_transform() in Matplotlib" class="wp-image-2203"/>
Understanding Power Transformation
Power transformation is a technique used to stabilize variance and make data conform more closely to a normal distribution. It involves applying a mathematical function to the data, which adjusts the values in a way that reduces the impact of outliers and skewness.
Benefits of Power Transformation
- Helps address skewed data: Power transformation is particularly useful for data with a skewness towards one tail of the distribution.
- Improves model performance: Many machine learning algorithms assume a normal distribution, and power transformation can make the data more compatible with these assumptions.
- Reduces impact of outliers: Power transformation diminishes the influence of extreme values, making the data more resistant to outlier effects.
Scikit-Learn’s Power Transform Function
Scikit-Learn, a widely used machine learning library in Python, provides the power_transform function in its preprocessing module. This function offers an easy way to apply power transformations to your data.
Parameters of power_transform
The power_transform function allows you to customize the transformation process with a few key parameters:
- method: It determines the type of power transformation to apply. Options include ‘yeo-johnson’ and ‘box-cox’.
- standardize: This parameter, if set to True, standardizes the transformed data to have zero mean and unit variance.
Using power_transform in Your Workflow
Integrating power_transform into your machine learning workflow involves a few simple steps:
- Import the necessary module: Start by importing power_transform from Scikit-Learn’s preprocessing module.
- Prepare your data: Ensure that the data you want to transform is appropriately preprocessed and ready for transformation.
- Apply power transformation: Use the power_transform function with your chosen parameters to transform the data.
- Further processing: Depending on your needs, you can now use the transformed data for training your machine learning model.
Considerations and Caveats
While power_transform can be highly beneficial, there are a few things to keep in mind:
- Applicability: Power transformation might not always be suitable, especially if your data is already well-behaved or doesn’t exhibit significant skewness.
- Parameter tuning: Choosing the right transformation method and parameters requires experimentation and validation.
- Interpretation: Remember that power-transformed data might differ from the original data in terms of interpretability.
Python Code Examples
Power Transform Example
import numpy as np
from sklearn.preprocessing import power_transform
# Sample data with positive skewness
data = np.array([[1.0], [2.0], [3.0], [4.0], [5.0]])

# Apply Yeo-Johnson power transformation
transformed_data = power_transform(data, method='yeo-johnson')

print(f'Data:\n {data}\n')
print(f'Transformed data:\n {transformed_data}\n')

Visualize Scikit-Learn Preprocessing power_transform with Python
To better understand the effects of the power_transform function from Scikit-Learn’s preprocessing module, we can visualize its impact on a built-in dataset using the Matplotlib library.
import numpy as np
import matplotlib.pyplot as plt
from sklearn.datasets import load_iris
from sklearn.preprocessing import power_transform

# Load the Iris dataset
data = load_iris()
X = data.data[:, 0].reshape(-1, 1)  # Select sepal length feature

# Apply Yeo-Johnson power transformation
transformed_data = power_transform(X, method='yeo-johnson')

# Create subplots
fig, axes = plt.subplots(1, 2, figsize=(12, 6))

# Plot original data
axes[0].hist(X, bins=20, color='blue', alpha=0.7)
axes[0].set_title('Original Data')
axes[0].set_xlabel('Sepal Length')
axes[0].set_ylabel('Frequency')

# Plot transformed data
axes[1].hist(transformed_data, bins=20, color='green', alpha=0.7)
axes[1].set_title('Transformed Data')
axes[1].set_xlabel('Transformed Sepal Length')
axes[1].set_ylabel('Frequency')

plt.tight_layout()
plt.show()
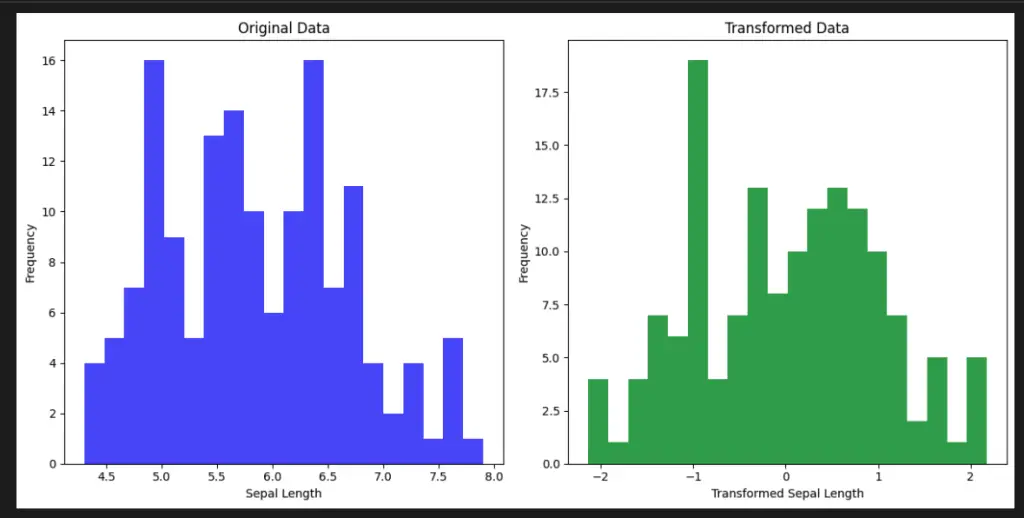
In this code example, we use the Iris dataset and focus on the sepal length feature. We apply the Yeo-Johnson power transformation using the power_transform function. The code then creates a side-by-side comparison of the original and transformed data distributions using histograms.
power_transform() in Matplotlib" class="wp-image-2203"/>This visualization helps us see how the power transformation can influence the distribution of the data and potentially make it more suitable for machine learning algorithms that assume a normal distribution.
Important Concepts in Scikit-Learn Preprocessing power_transform
- Data Transformation
- Skewed Data
- Normal Distribution
- Outliers
- Transformation Methods: ‘yeo-johnson’ and ‘box-cox’
- Standardization
- Machine Learning Assumptions
- Impact on Model Performance
To Know Before You Learn Scikit-Learn Preprocessing power_transform?
- Basic understanding of machine learning concepts and terminology.
- Familiarity with Python programming language and its syntax.
- Understanding of data preprocessing techniques, such as scaling and encoding.
- Awareness of data distributions, skewness, and normality.
- Knowledge of how outliers can impact data analysis and modeling.
- Familiarity with Scikit-Learn library and its preprocessing module.
- Basic grasp of statistical concepts like variance, mean, and standard deviation.
- Understanding of the assumptions underlying various machine learning algorithms.
What’s Next?
- Feature Engineering: Techniques for creating new features from existing data.
- Handling Missing Data: Strategies to deal with missing values in your dataset.
- Advanced Preprocessing Techniques: Exploring other data transformation methods.
- Model Selection: Choosing the right machine learning algorithms for your transformed data.
- Hyperparameter Tuning: Optimizing model performance through parameter adjustments.
- Evaluation Metrics: Understanding how to assess model performance effectively.
- Ensemble Methods: Learning about combining multiple models for better predictions.
- Deployment: Taking your trained model and making it accessible for predictions.
Relevant Entities
| Entities | Properties |
|---|---|
| Scikit-Learn | Machine learning library in Python |
| Power Transformation | Stabilizes variance, normalizes distribution |
| Data Transformation | Enhances data quality, improves model compatibility |
| Skewed Data | Non-Gaussian distribution, tail-heavy |
| Normal Distribution | Gaussian distribution, symmetric bell curve |
| Outliers | Extreme values, impacts data analysis |
| Method Parameter | ‘yeo-johnson’ or ‘box-cox’ transformation |
| Standardize Parameter | Zero mean, unit variance transformation |
Conclusion
Scikit-Learn’s power_transform offers a valuable tool for enhancing the quality of your data in preparation for machine learning. By understanding the concept of power transformation and how to use this function effectively, you can significantly improve model performance and make your predictions more accurate.
